Paradox · Statistics
Simpson's paradox
- Same age:
- 20–34 -5.3
- 35–49 -5.8
- 50–64 -6.1
- 65+ -7.4
What you are looking at
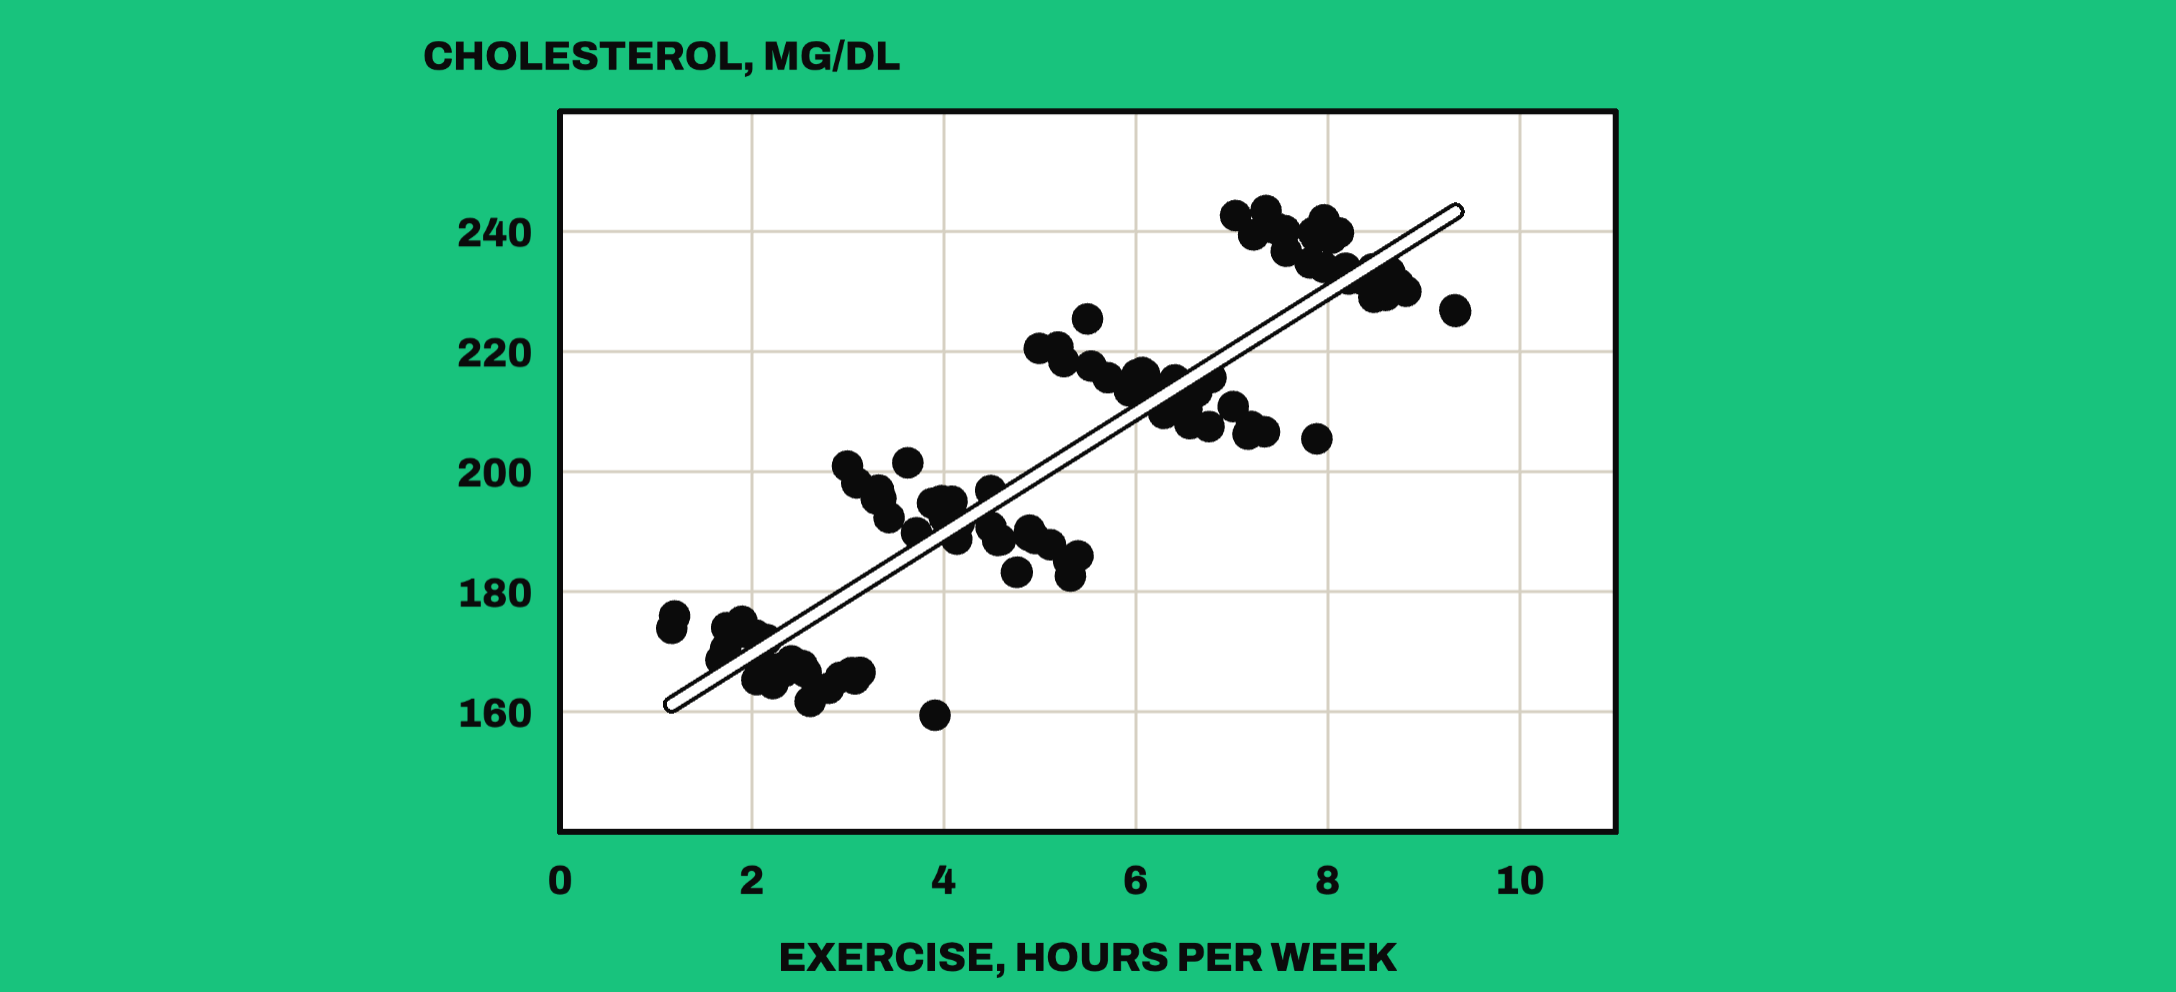
Each dot is a person in an invented study: how many hours a week they exercise, and their cholesterol. The line through the cloud climbs. On average, every extra hour of exercise goes with about 10 mg/dL more cholesterol.
Read at face value, the chart says exercise is bad for you.
Turn it
Drag the chart, or press Split by age. The flat cloud was hiding a third dimension: the age of each person. Seen from the side, it comes apart into four groups, and inside every one of them the line falls. Among people of the same age, an extra hour of exercise goes with 5 to 7 mg/dL less cholesterol.
Nothing was changed. They are the same dots, seen from a different place.
Why it happens
In this study older people exercise more, and older people also have higher cholesterol, for reasons that have nothing to do with exercise. Pool everyone and you mostly compare the young with the old. The climbing line is the effect of age, wearing the label of exercise.
Age here is a confounder: something that pushes on both of the things you are measuring. A flat chart cannot show it, in the same way that a shadow cannot show depth.
Which answer is right
That is the uncomfortable part: the numbers alone cannot tell you. Both lines are correctly computed. To choose between them you need to know how the world works, which is to say what causes what. Here age affects both exercise and cholesterol, so you compare like with like and trust the groups: exercise helps.
But splitting is not always right. Had the third variable been something exercise itself changes, such as body weight, splitting by it would have hidden part of the benefit. The same table can call for opposite readings depending on the story behind it.
Where it comes from
Edward Simpson described it in 1951, though Karl Pearson and Udny Yule had noticed it half a century earlier. The most famous case is real: in 1973 the University of California, Berkeley admitted 44% of the men who applied to its graduate school and 35% of the women. Department by department, the gap vanished or slightly favoured women. Women had applied in greater numbers to the departments that turned most people away.